Dashboard
This project builds an end-to-end Power BI dashboard from a public e-commerce sales dataset. Starting from a raw CSV, the workflow covers data import and quality checks, designing a star-schema data model, creating a calculated date table in DAX to enable time-based interactivity, and finally building a two-page interactive dashboard for revenue, product, region, and customer analysis.
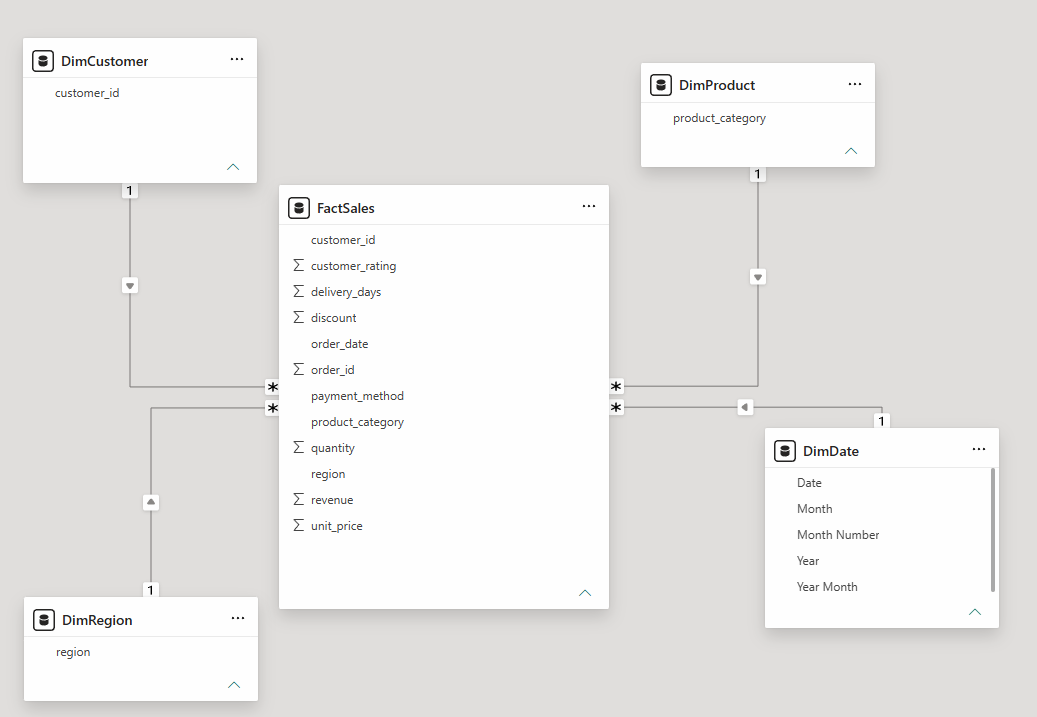
- Modelled the data into a clean star schema — one FactSales table linked to four dimensions (Customer, Product, Region, Date).
- Built a calculated Date table in DAX to unlock time intelligence and month-level slicing across every visual.
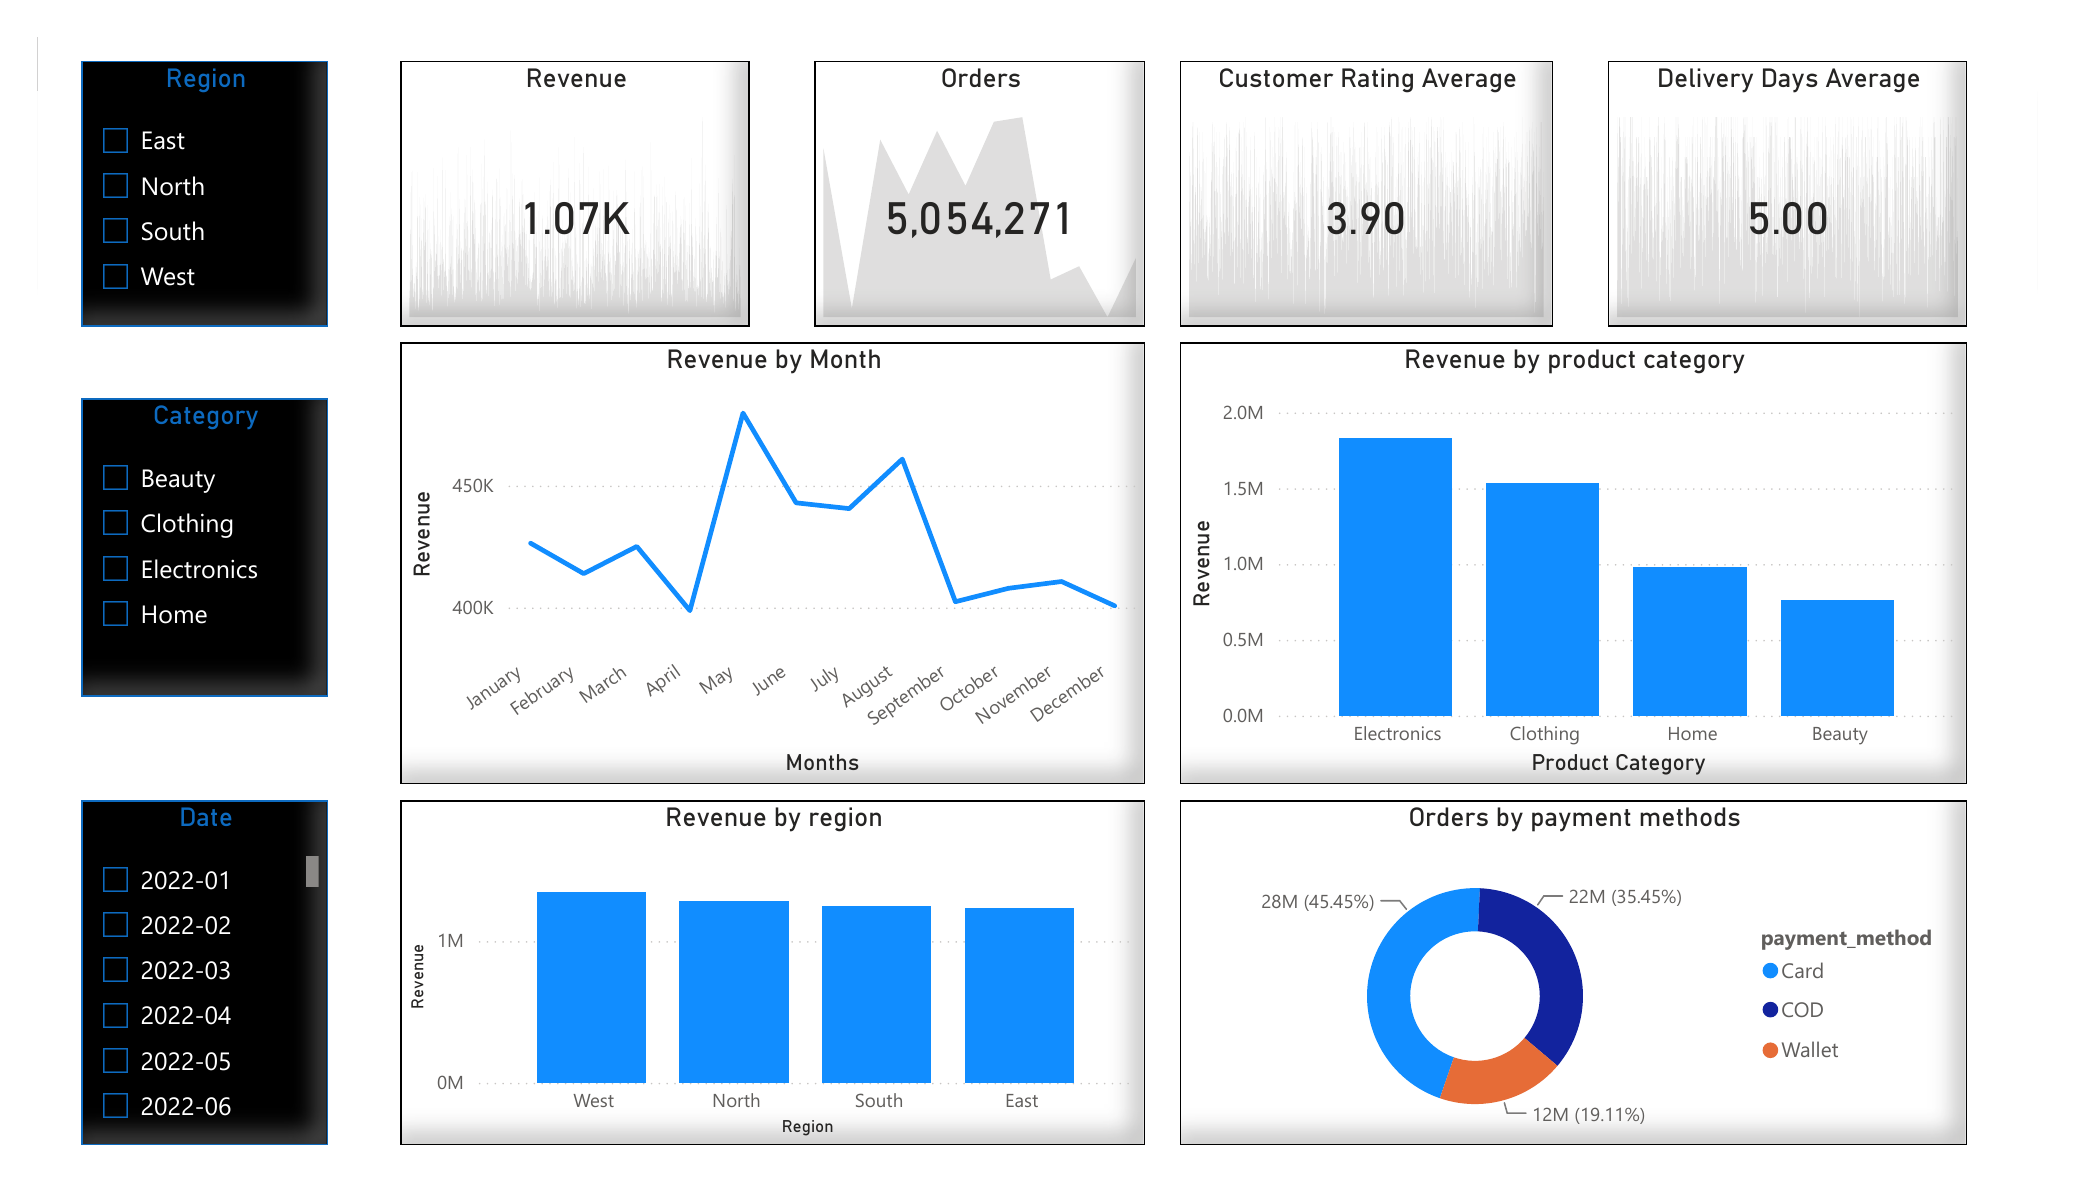
- Electronics was the leading product category by revenue; Card payments made up 45% of all orders.
- Delivered a two-page interactive dashboard with slicers for region, category, and date, plus drill-down on revenue, ratings, and delivery performance.
The headline of the project is a two-page interactive dashboard. The first page gives a high-level view of business performance: KPI cards for total revenue, orders, average customer rating, and average delivery days, followed by revenue broken down by month, product category, region, and payment method — all filterable by region, category, and date.
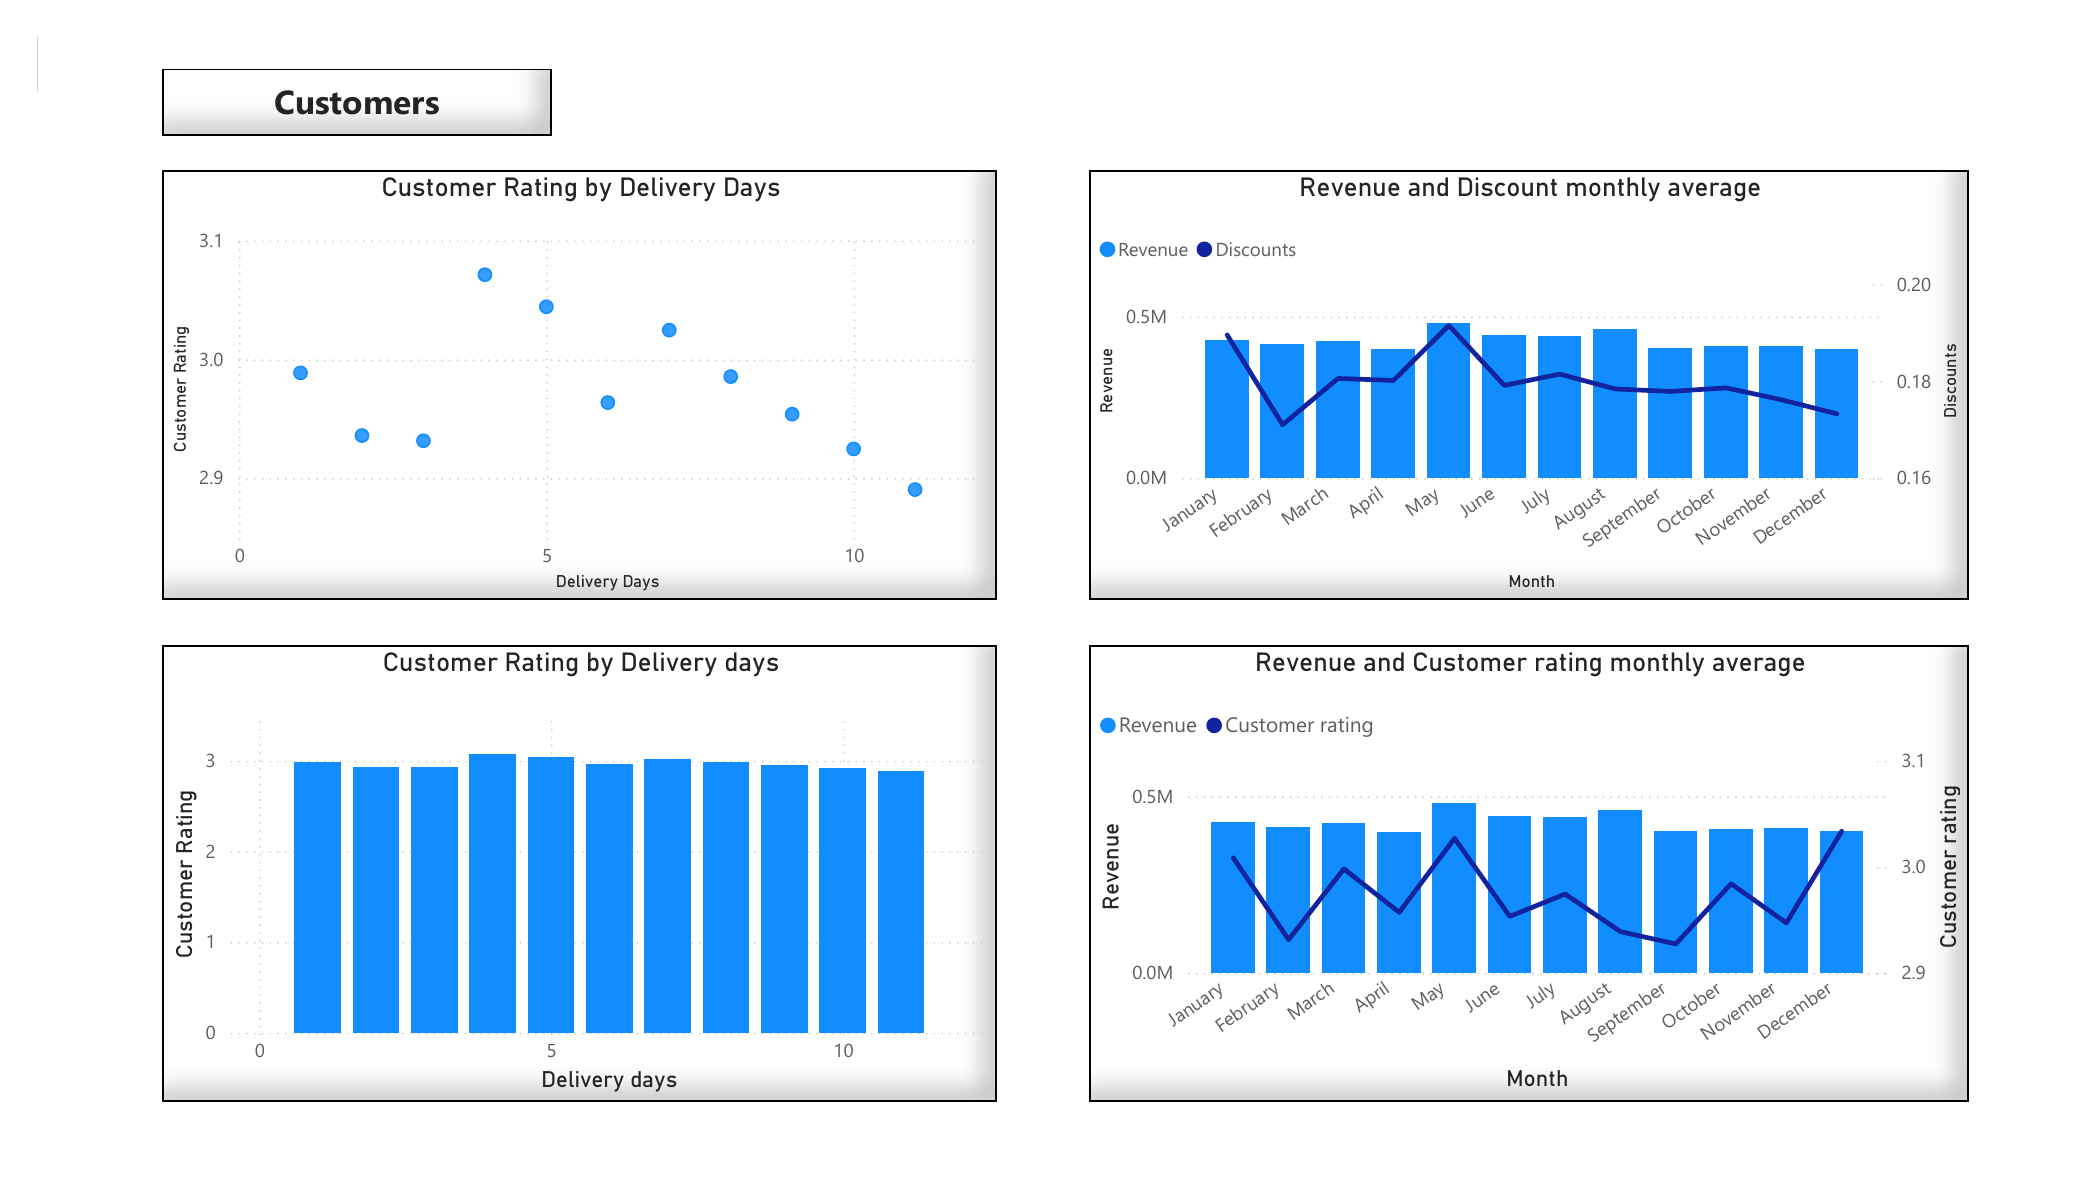
The second page digs into relationships: monthly revenue against average discount, monthly revenue against average customer rating, and how customer rating varies with delivery days — helping connect operational metrics to customer satisfaction.
Behind the dashboard, the workflow starts from a public e-commerce dataset in CSV format. It was imported into Power BI through Power Query, where each column's data type was validated and the data was checked for blanks, duplicates, and inconsistent categories before modelling.
The data was structured into a star schema: a central FactSales table holding the measures (revenue, quantity, discount, ratings, delivery days) surrounded by four dimension tables — DimCustomer, DimProduct, DimRegion, and DimDate — each joined on a one-to-many relationship.
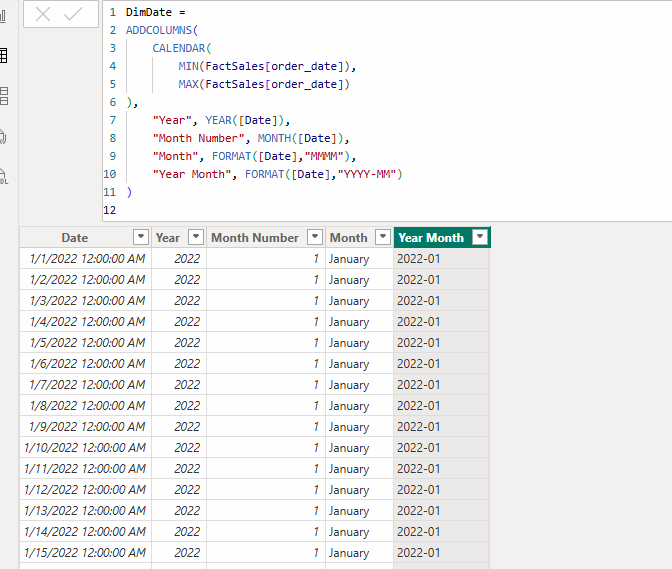
To enable time-based analysis and consistent month/year slicing, a dedicated DimDate table was generated with DAX. CALENDAR builds a continuous date range from the earliest to latest order date, and ADDCOLUMNS derives Year, Month, Month Number, and a sortable Year-Month key.
DimDate =
ADDCOLUMNS(
    CALENDAR(
        MIN(FactSales[order_date]),
        MAX(FactSales[order_date])
    ),
    "Year", YEAR([Date]),
    "Month Number", MONTH([Date]),
    "Month", FORMAT([Date], "MMMM"),
    "Year Month", FORMAT([Date], "YYYY-MM")
)